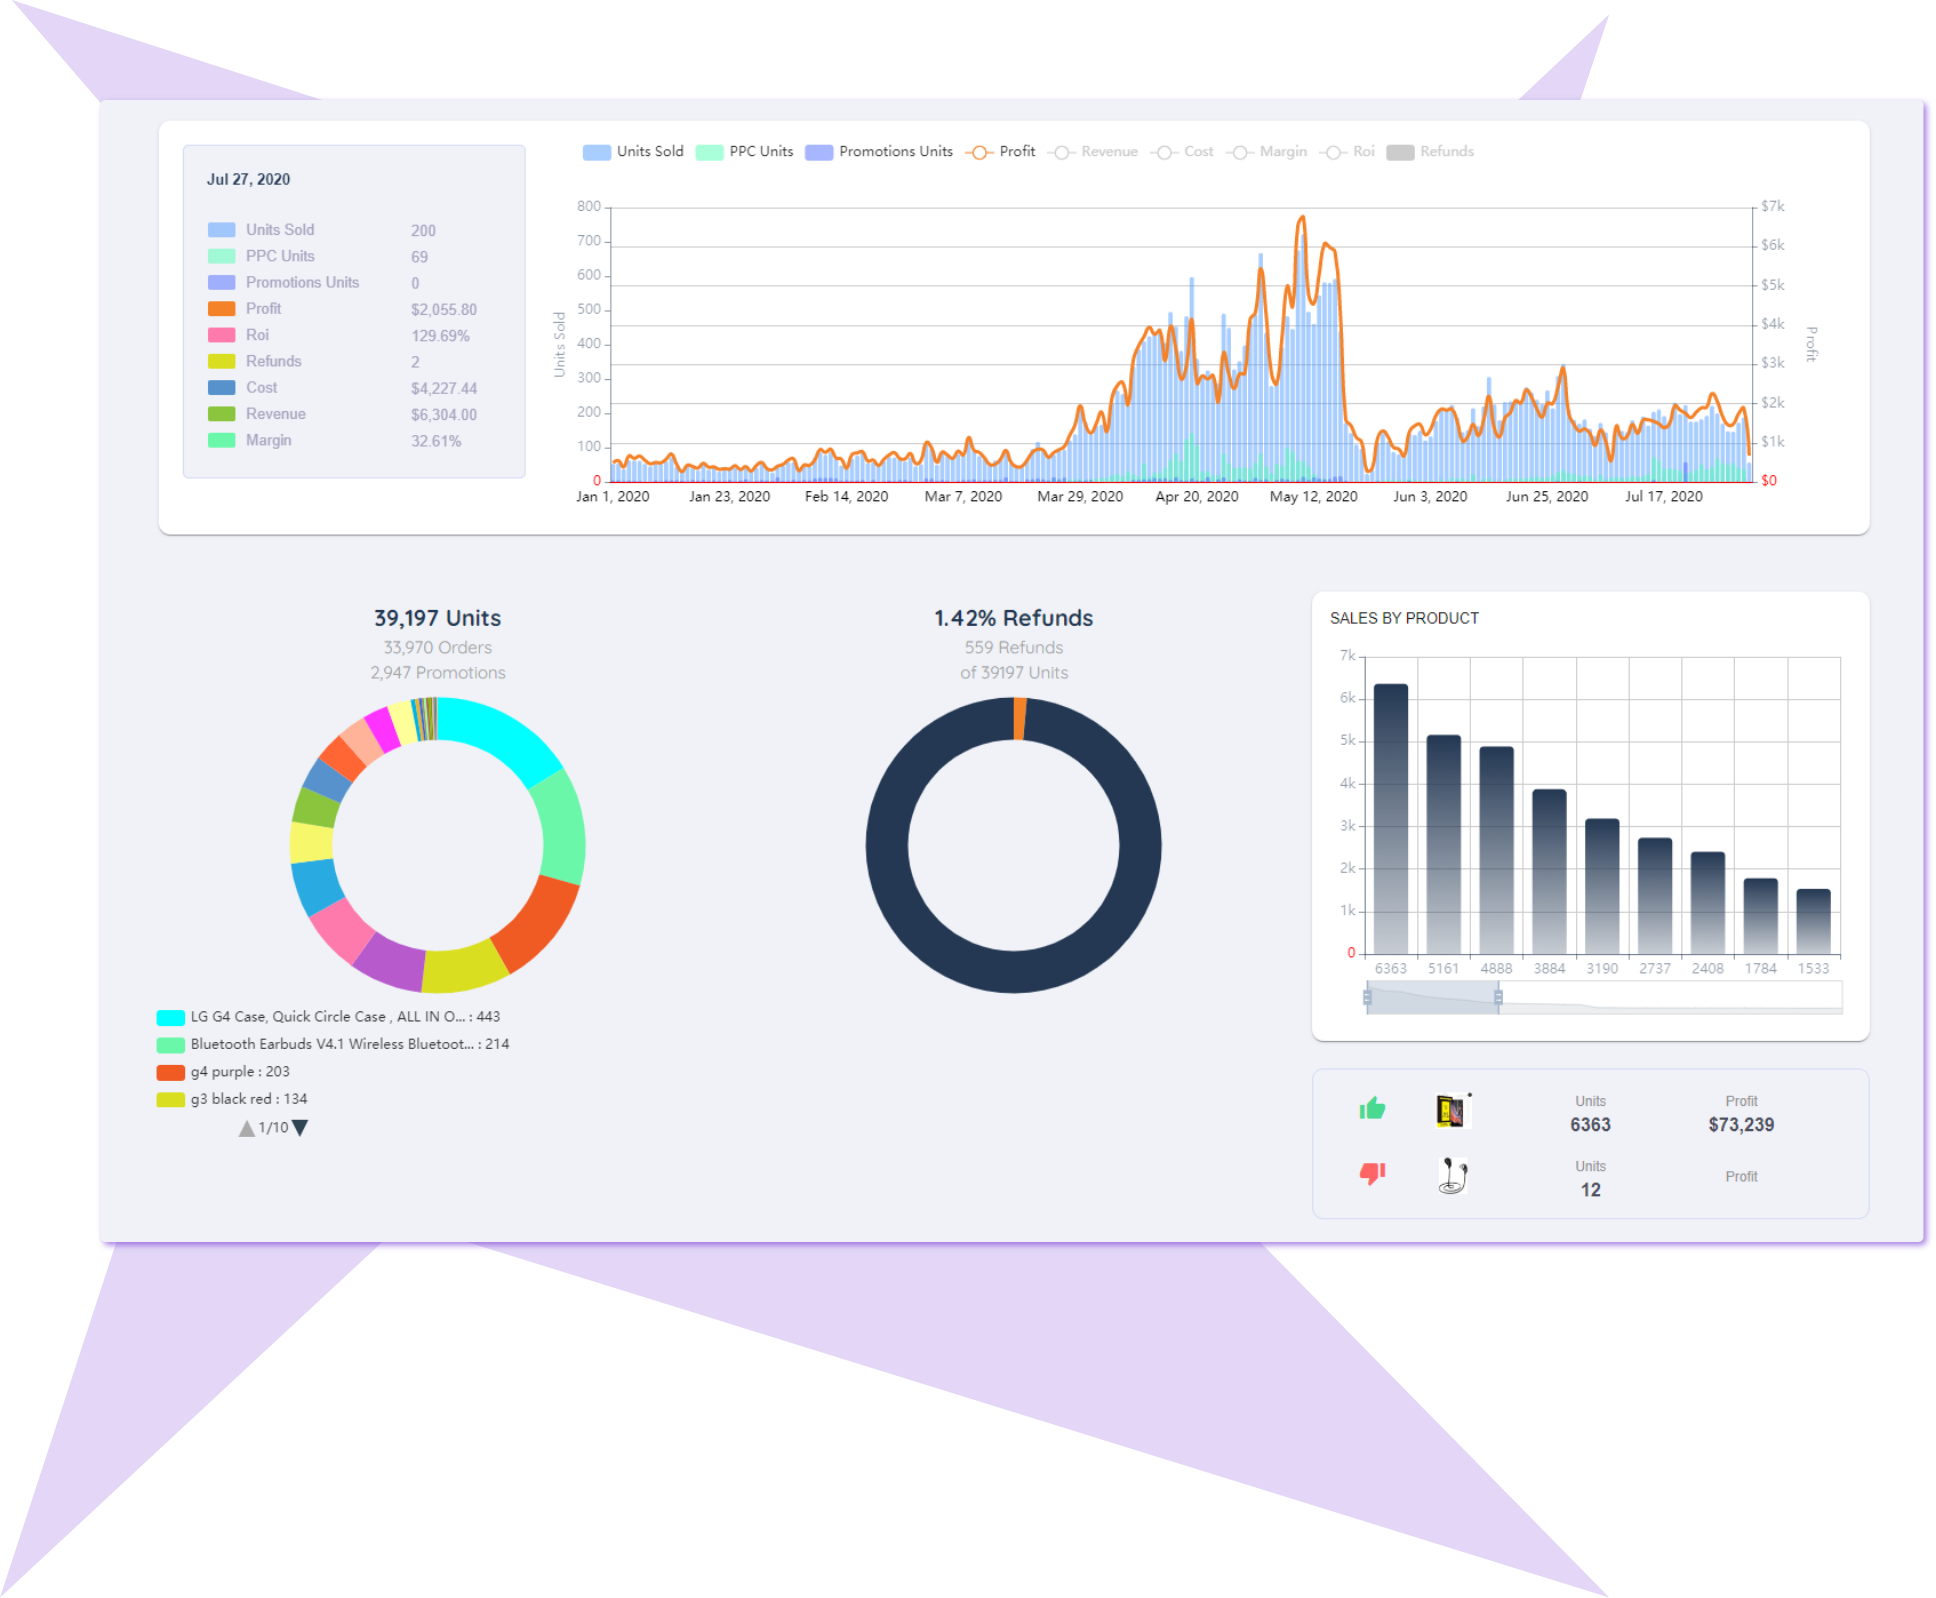
Our Profit page presents unique BI solutions that provides a summary of historical, and present data

All the data and account analytics you'll see are automatically compared to the corresponding time period. Reveling important information.

We present you not only near real time detailed information but also the most accurate profit and loss calculations.

Increase in Profit
Increase ROI
Increase in Margin
Every day your business creates an overwhelming amount and variety of data, its easy to loose track and get lost!
When dealing with business analysis you need answers that allows you to make quick decisions thus improve apparatus.
That is exactly why we created this Profit Page, The different features found in the Profit page will help you get a clear picture of your business finances.


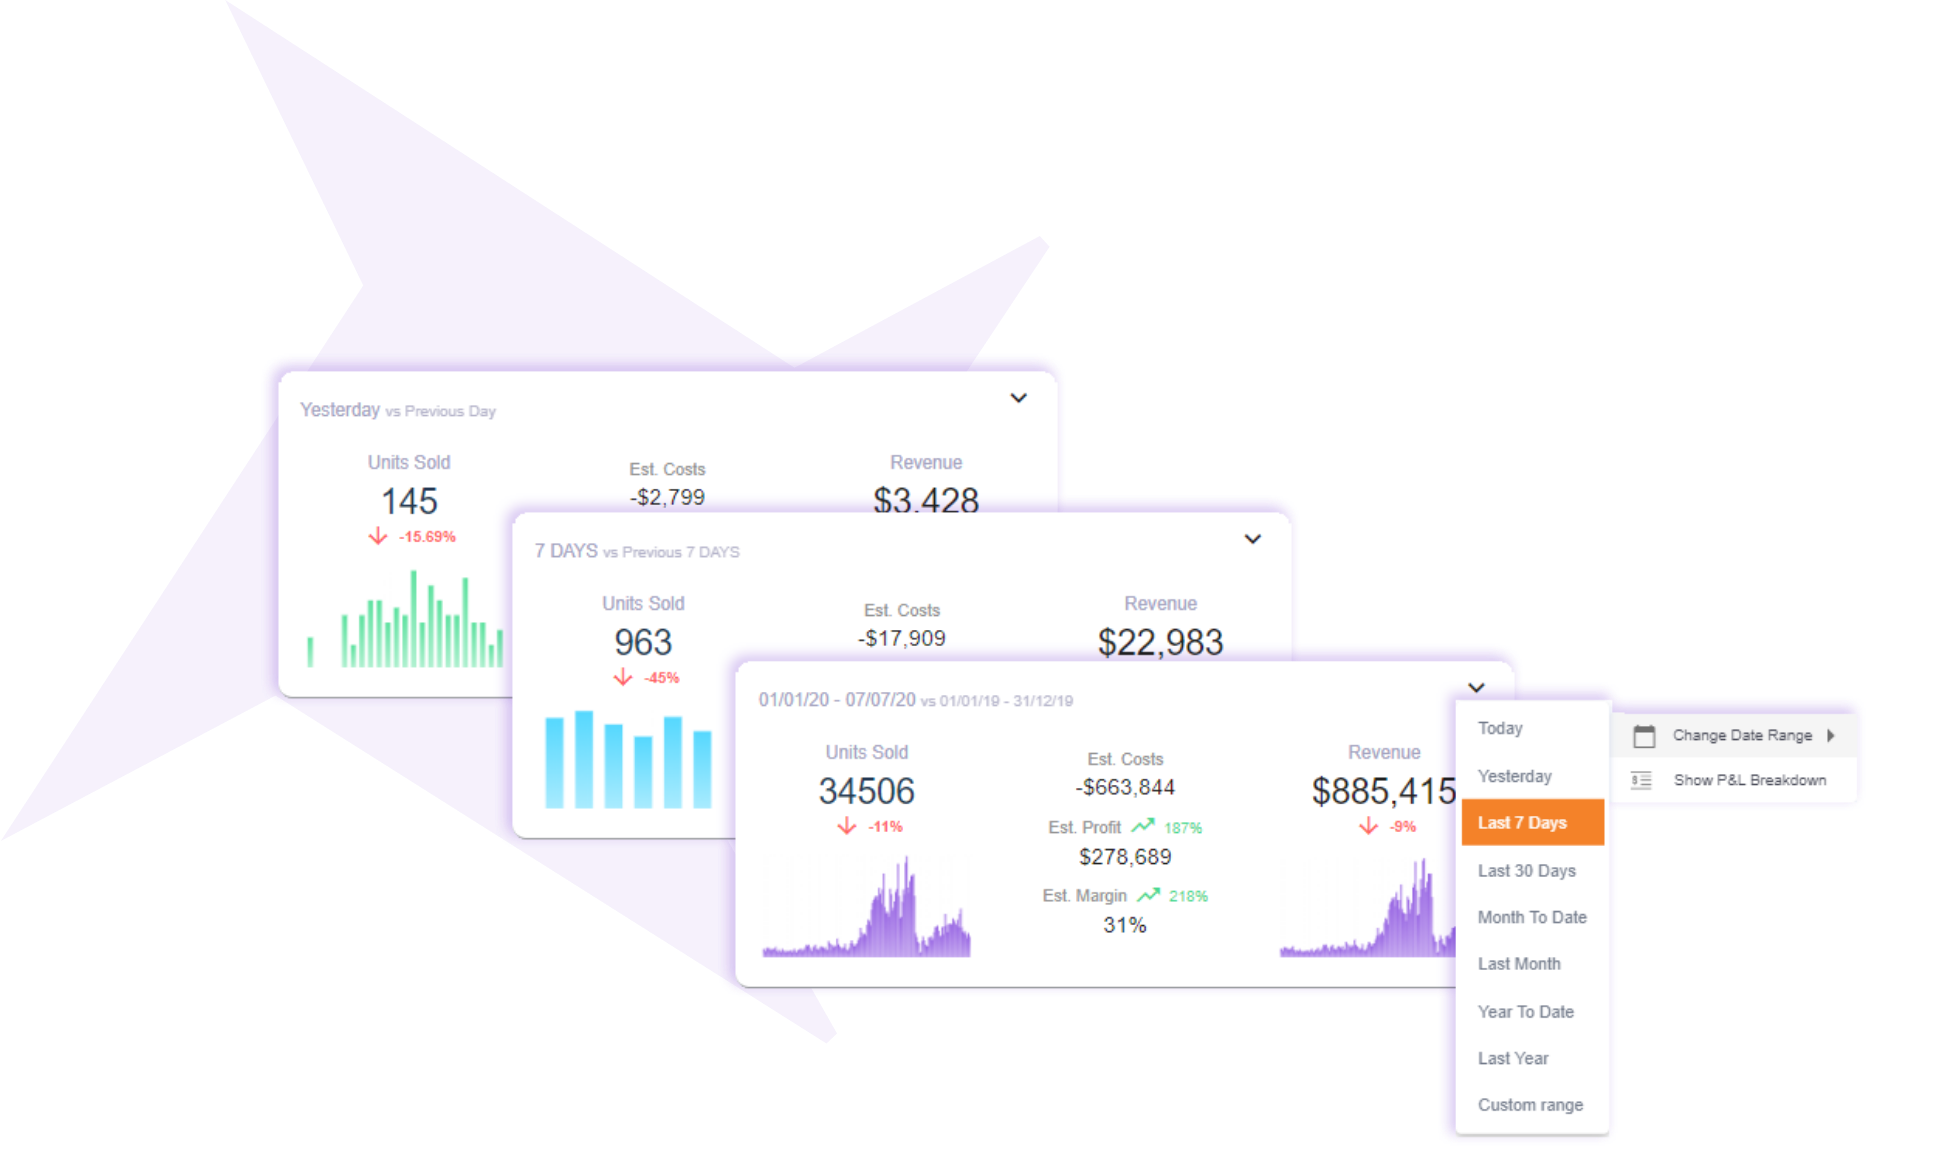
That is exactly the case with our KPI boxes.
Each box can be set to a different time frame and holds a bundle of pop ups showing you the ins and outs of your business.
Sometimes you want a quick overall look and sometimes you need to get specific details. Our tow charts allow you to really drill down!
● For those days you want an easy simple visualization of your business performance.
We created our Bar Chart That let you customize critical metrics and evaluate your store. helping you identify trends over time, and gain the insights you need.
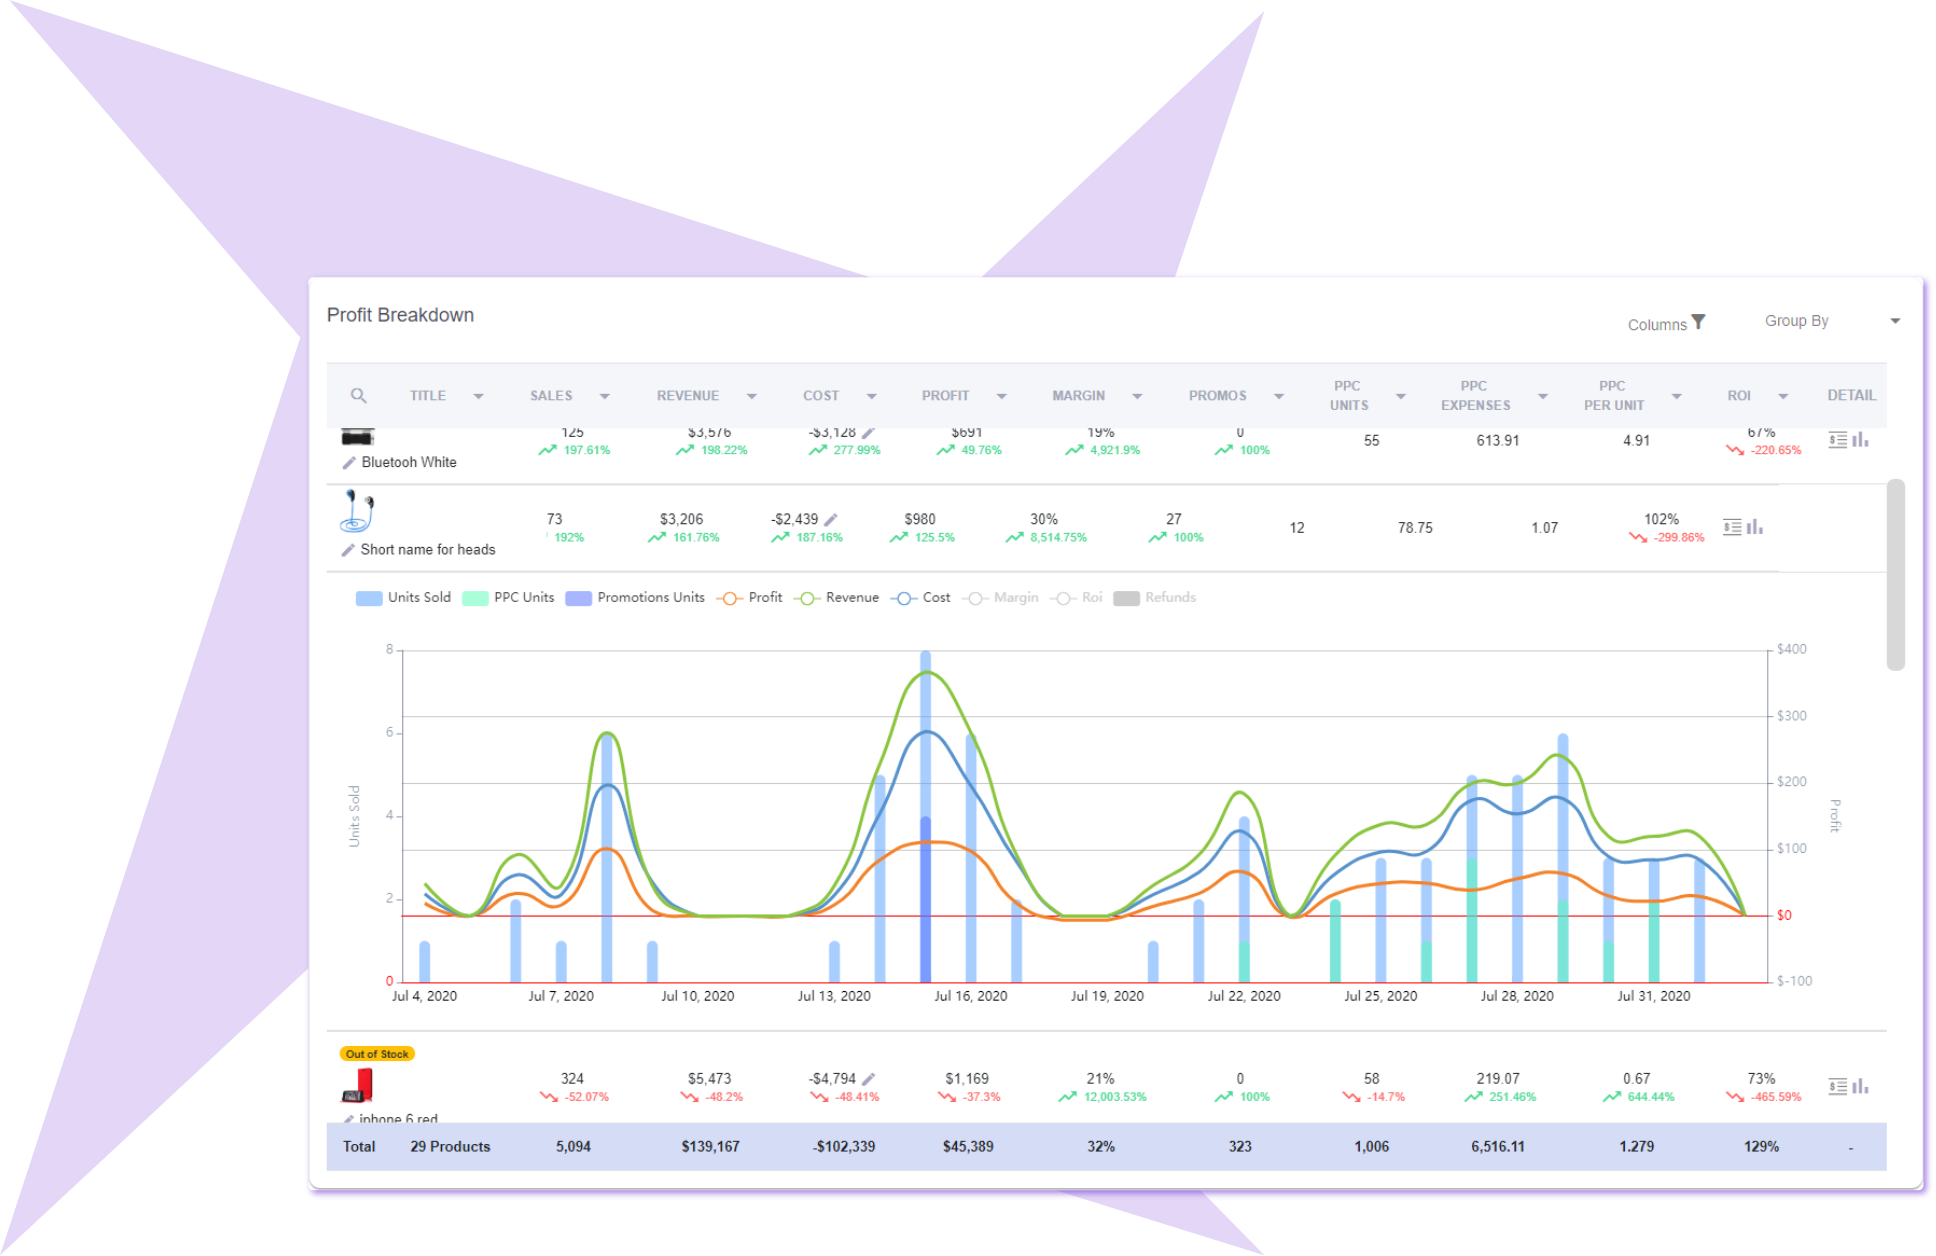
● And for the days you want to get to the bottom line our Breakdown Table shows you detailed profit and PPC expenses and performance by product, marketplace or brand!
